
Ad hoc analysis can become a potent solution to the increasing complexity of modern business environments. Learn about it in this article!
I. Introduction
A. Why lack of analytics is dangerous: Google’s failure
Speed of analysis is essential in the modern business world. If you’re too slow to analyze the existing trends in the development of technologies, your business will inevitably fail. A strong example of massive damage from insufficient analysis is Google. Before 2023, Google was considered one of the most undefeatable businesses. Despite minor failures of its pet projects, the business managed to capture multiple large-scale markets. It became a de facto monopoly in online searches. Its Workspace suite continues to be the best corporate product for startups. Still, in 2023, Google lost 100 billion dollars in response to one miscalculation. The company failed to allocate enough investments into artificial intelligence. As a result, its quality was lower than expected.
Do you want to avoid such situations? In that case, it’s time to learn about ad hoc analysis.
B. Ad hoc analysis: Definition
What is ad-hoc analysis? In our opinion, its definition consists of two major components. Firstly, ad hoc analysis is notable for maximal speed. It uses modern tools, such as AI, to review varying aspects of reality fast. Secondly, a major part of the ad hoc analysis is its targeted nature. The ad hoc analysis doesn’t target all marketing issues or potential innovations. It concentrates on one hypothesis regarding one specific issue.
We believe that Google could have prevented its problems through ad hoc analysis. Why? On the one hand, it would have been capable of targeting AI alone. On the other hand, the analysis would have been fast, allowing a quick reaction to market trends.
C. Importance of ad hoc analysis
Why is ad hoc analysis so important in modern data-driven decision-making? In our opinion, this approach to analytics is vital due to the increasing pace of innovation. In the 1920s, Ludwig von Mises formulated the so-called calculation problem. Targeted at socialism, it nonetheless has great implications for all information-centric societies. According to the libertarian approach, our society is too advanced to calculate. Humans are the pinnacle of development for matter. Consequently, their actions can be infinitely complex. Moreover, the progress of our civilization makes calculation increasingly difficult. The potential for innovation that stems from AI and quantum computing is tremendous. In the end, the complexity of our society will always outpace our calculation capabilities.
In this light, ad hoc analysis is an ideal solution to the presented problem. Why? It allows for introducing on-the-fly changes to our existing prediction models. In the future, businesses will focus on quarterly analytics and continuous (even daily) ad hoc analysis. Only they can provide enough information to help with reasonable decisions in the ever-changing market. Ultimately, the key goal of this article is to outline how to do ad hoc analysis. You’ll learn about the key practices for it and study the benefits of the methodology in-depth.
II. Understanding Ad Hoc Analysis
A. Definition of ad hoc analysis
We’ve already outlined the key aspects of ad hoc analysis in the introduction. Let’s unite the two elements, speed, and targeted nature, into a definition. So, ad hoc data analysis is a high-speed analysis of a specific business phenomenon. A strong example of ad hoc analysis is the review of click-through rates in isolation from other aspects. Why is it so useful? In our opinion, fast analysis can help discover major trends outside common-sense thinking. You can then use ad hoc analysis to learn if you need new criteria for your business intelligence.
B. Key concepts in ad hoc analysis
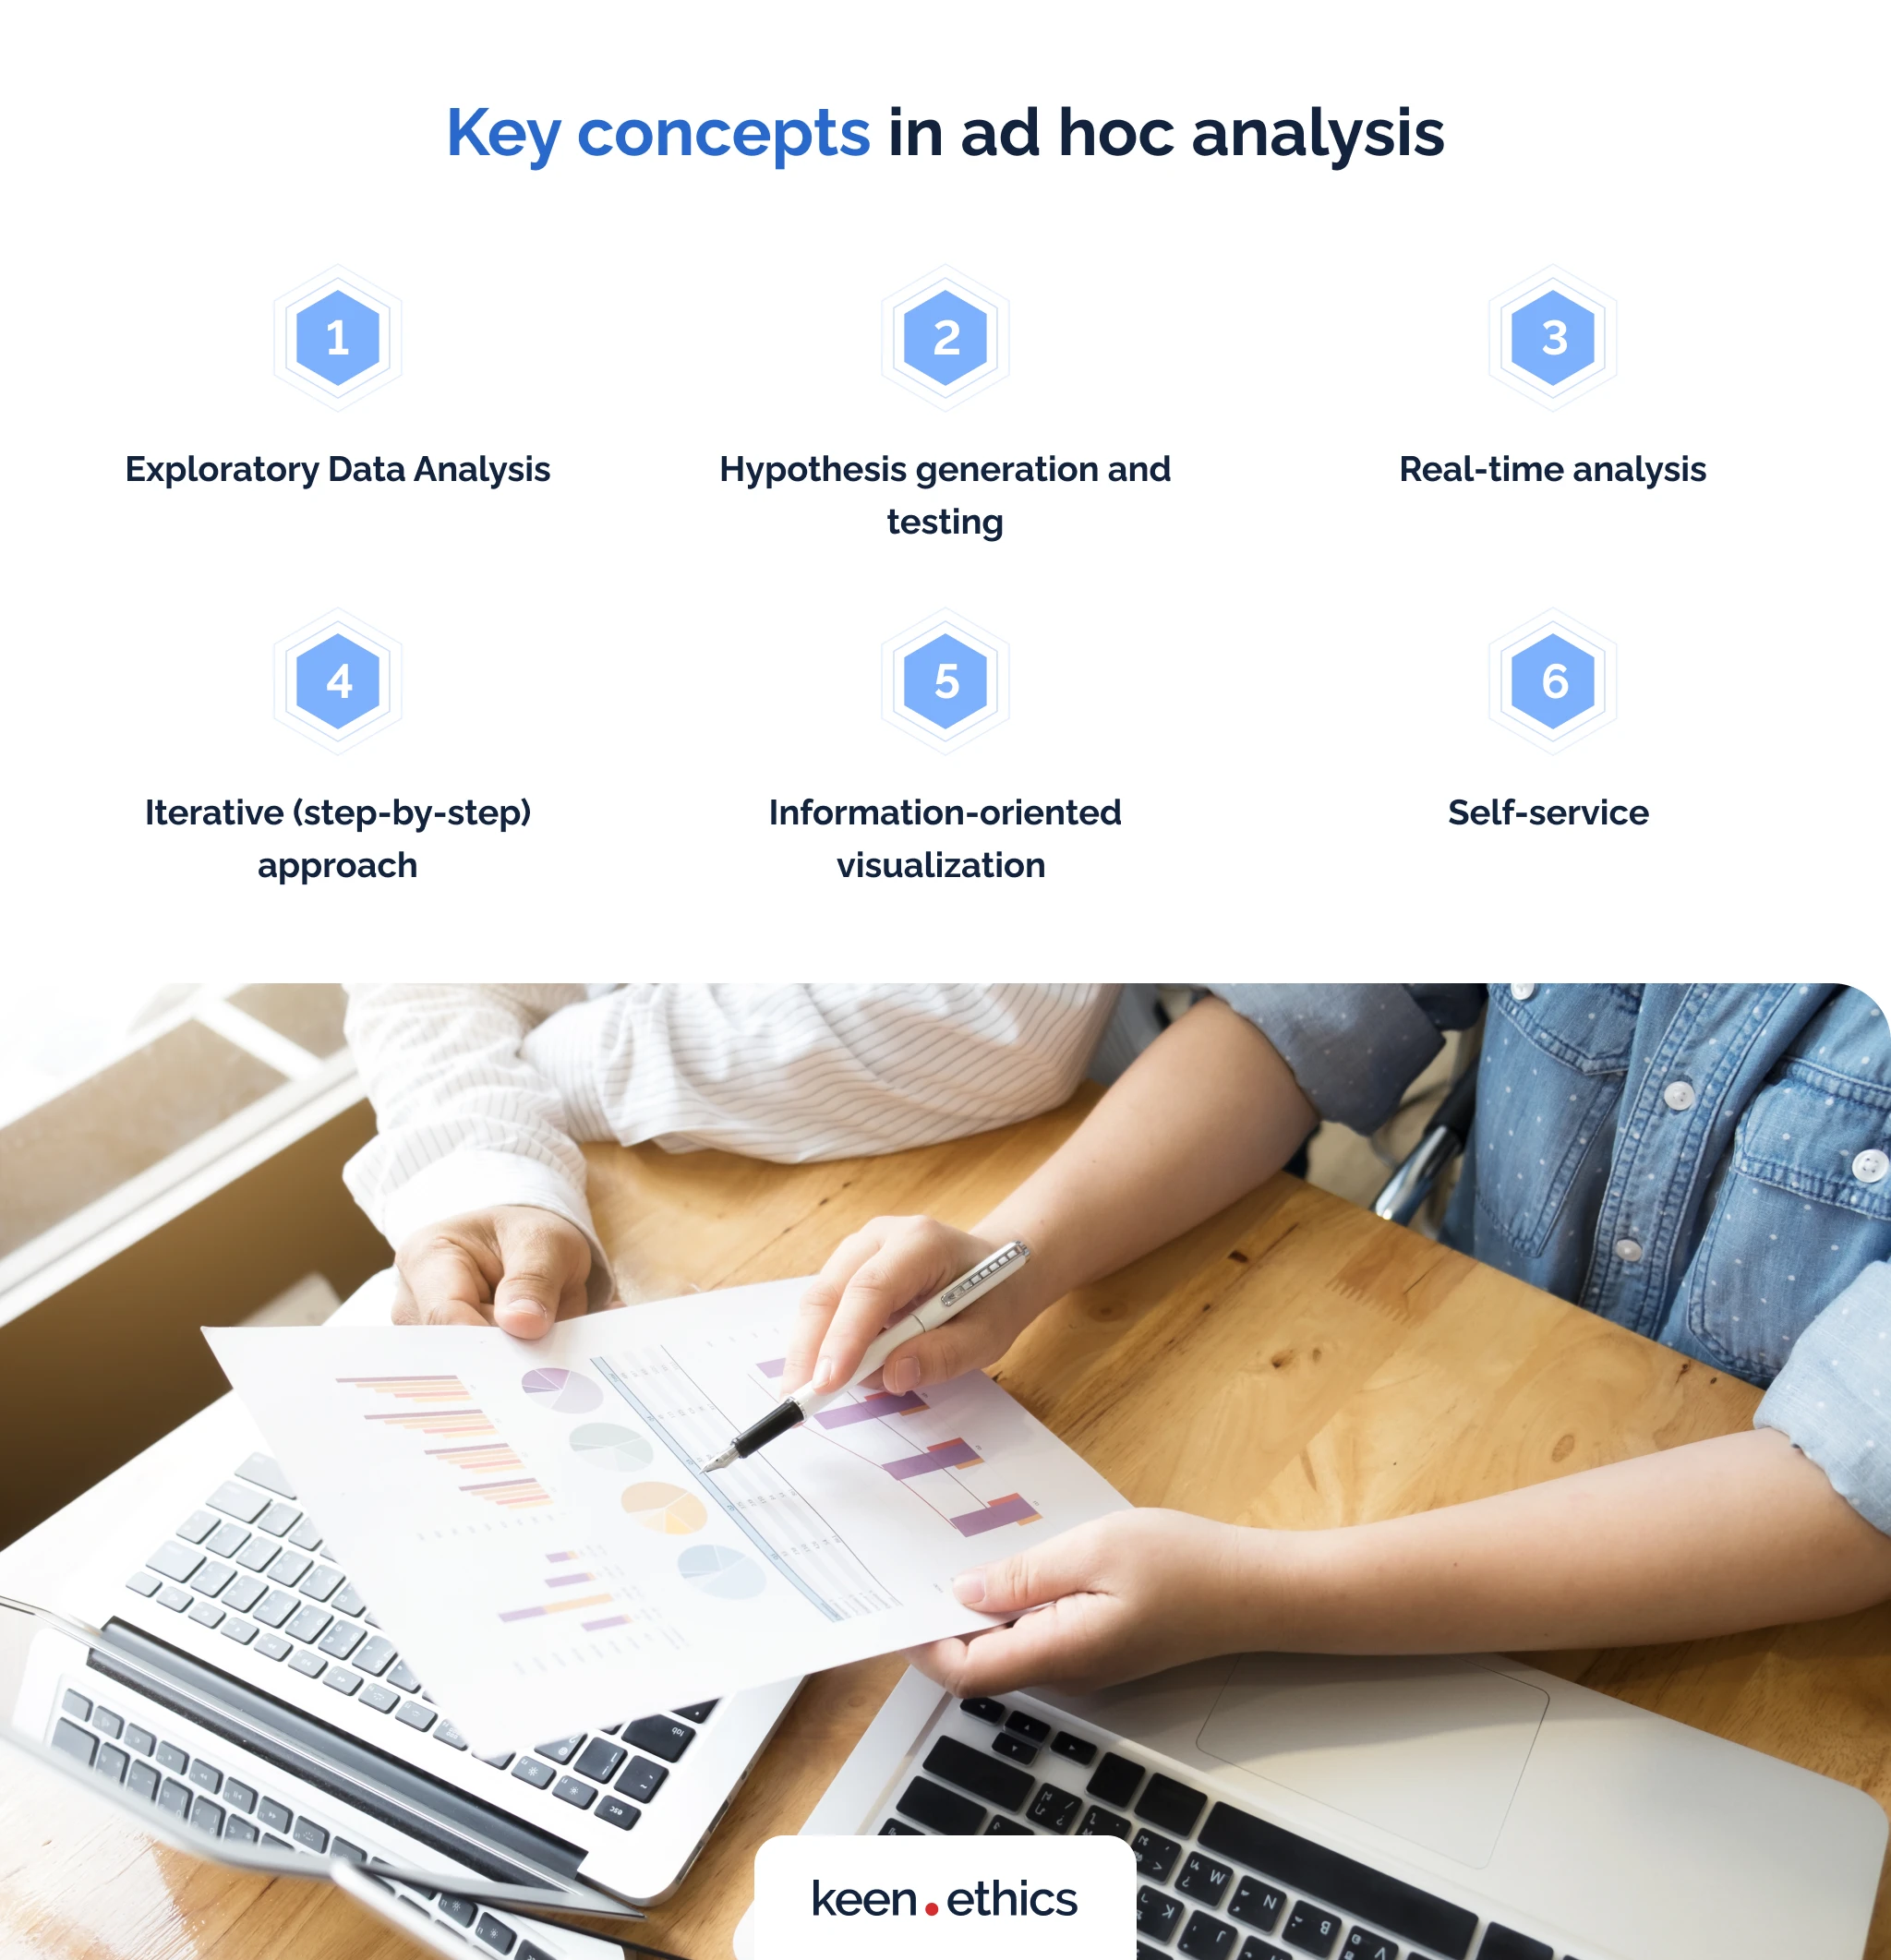
What are some key concepts you need to know in ad hoc analysis? In our opinion, you should pay attention to the following features:
Exploratory Data Analysis
The ad hoc platform represents a strong example of this concept. We usually do ad hoc analysis to find answers to specific questions. Is it rational to do this analysis for all phenomena? In our opinion, no. There are too many phenomena. As a result, the key reason to do ad hoc analysis is to analyze some black swan events. Nassim Taleb developed this concept to describe events that go beyond our expectations.
For many years, Europeans believed that only white swans existed. Later, they found black swans on other continents, breaking their theory. Ad hoc analysis is perfect for reviewing such “black swans.” The idea is to first analyze them in isolation to understand how they change the existing models. In short, ad hoc analysis is exploratory.
Hypothesis generation and testing
Since ad hoc analysis deals with unexpected events, you need to think about them in the context of your existing prediction models. Ad hoc analysis requires an ability to think scientifically. Your key goal is to create multiple ideas for how a black swan event lands in your model. You must be able to establish hypotheses about those events. What are they? How do they fit into the existing framework? Do they require new frameworks?
After that, the key idea is to test the presented hypotheses. Overall, we see ad hoc analysis as the expansion of advanced scientific methods in business analytics. In a way, 17th-century rationalist philosophers such as Locke and Hobbes laid its foundation. Read those classics if you want to understand the methodological basics of ad hoc analysis.
Real-time analysis
One of the key differences between ad hoc analysis and “normal” analysis is its real-time nature. The real-time nature of ad hoc analysis is present in two aspects. Firstly, ad hoc analysis is designed to be as fast as possible. Secondly, and more importantly, its key ability is to react to events as they appear. For example, if a trend like AI in language learning appears, ad hoc analysis helps one react immediately. Platforms like Duolingo Max are developed en masse on the market. When traditional models reflect these issues, they’ll already be outdated.
Iterative (step-by-step) approach
A significant strength of many ad hoc models is the relative simplicity of data within them. It’s difficult to perform iterative analysis in a full-scale analytical tool. Usually, they require tremendous amounts of information, so every iteration can take months. In turn, ad hoc analysis enables several iterations of data testing. You can put your information through numerous hypotheses. For instance, it’s possible to tie the growth of AI to manufacturing and education. You can test those hypotheses in small sessions that take two to three hours each. As a result, this analysis is much more flexible than past approaches.
Information-oriented visualization
A major principle of ad hoc analysis is data visualization. On the one hand, every ad hoc model has to be information-oriented. The more numerical information you have for it, the better. On the other hand, this data should also be easy to read. The key idea behind any ad hoc analysis is user-friendliness. Various innovations may be difficult to understand even for seasoned managers. For example, some of the most interesting papers on AI are philosophical. You need to be a philosopher to work with the arguments of people like Eliezer Yudkowski. Rationalism and materialism are often extremely complex. Only visualization can prepare non-expert audiences for them.
Self-service
Most advances in science come at the intersection of disciplines. We see the ultimate failure of physicalism today. It’s impossible to simplify everything to the physical level. Consequently, real advances occur at the intersection of humanities and STEM. AI is the prime example of this phenomenon. For instance, linguists propose to use corpora (collections of words and expressions) as an alternative source for modern generative AI. According to them, corpora-based models will promote a better understanding of language nuance. Sociologists and philosophers also play a major role in AI development. For instance, they highlight that AI models of the future will need human-like evolution.
Consciousness is a social process. It doesn’t emerge out of nothing. What’s the key challenge for all those specialists? Many of them don’t know math and statistics at a high level. For this reason, modern ad hoc analysis must enable them to engage in self-service. Self-service stands for user-friendly tools in data analysis. A person should be able to calculate and visualize data without advanced knowledge. If we involve linguistics, sociologists, and philosophers in AI discussions, major opportunities for improvement will appear. Self-service exists to help with that.
B. The role of ad hoc analysis in data analytics

In our opinion, ad hoc analysis plays a gigantic role in modern data analytics. It does several important things for the modern decision-makers. Firstly, ad hoc analysis is strong when you want to explore new topics. Due to the rise of AI tools, the complexity of our economy is growing all the time. When innovations come into being, you can use ad hoc analysis to integrate them into your models. Secondly, ad hoc analysis is a perfect way to work with multiple hypotheses fast. If you have numerous opinions on the reasons something happened, this framework will work well. It allows you to take multiple small elements and easily review them. Thirdly, ad hoc analysis is usually easy to implement. This factor means various non-experts can now engage in analytics. As mentioned above, an interesting insight can come from many directions. Linguists and philosophers may often have enough expertise to transform the key practices in AI or RPA.
Scientific methodology and ad hoc analysis
Ultimately, modern science methodology is the best way to see the interaction between ad hoc analysis and data analytics. Modern science has three levels of knowledge: hypothesis, theory, and law. A hypothesis is a realistic assumption about something. It doesn’t have a full-scale confirmation and doesn’t form into a complete system. A theory is a well-supported framework with a series of clear laws. It uses empirical data to establish rules that always work in certain conditions. For example, Newtonian gravitation is a proven law that works in certain conditions.
Ad hoc analysis as a tool for creating hypotheses
How does ad hoc analysis adapt to this triad? In our opinion, ad hoc analysis encompasses hypotheses and hypothesis testing. In short, its goal is to give some interesting propositions and then test them. Data analytics, such as business intelligence, is at a greater level. It creates theoretical explanations and even laws out of hypotheses. Ad hoc analysis essentially provides material for bigger theoretical assumptions. It creates new theories and destroys old ones. If one uses the language of Thomas Kuhn, a philosopher of science, ad hoc analysis brings paradigm shifts to well-established theories in business.
C. Benefits of ad hoc analysis
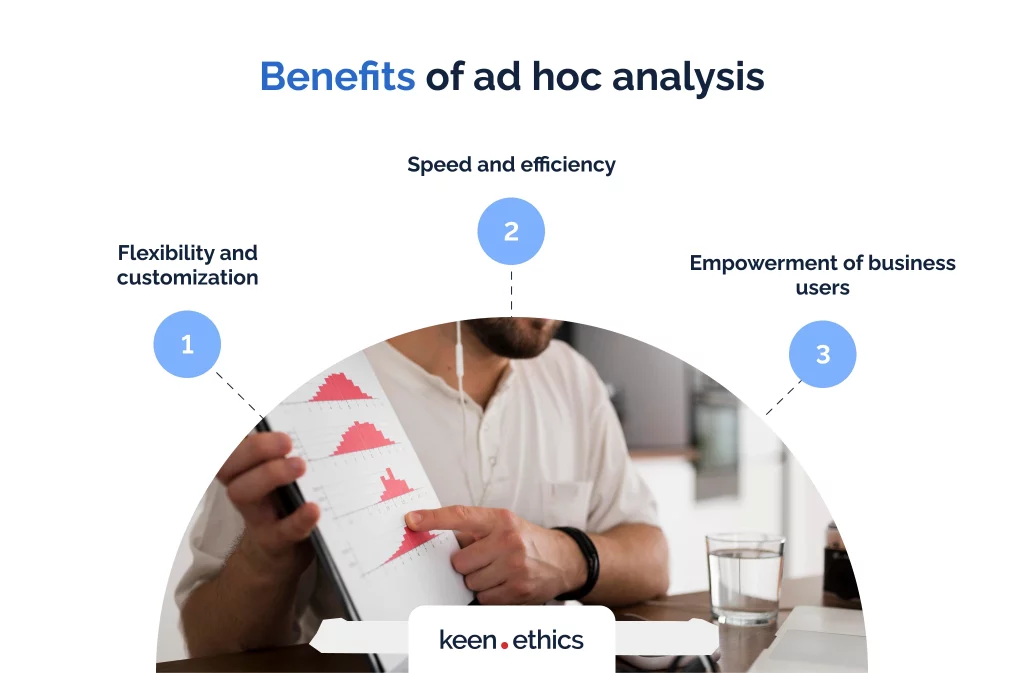
The benefits of ad hoc analysis are tremendous. In our opinion, every company should try implementing it as fast as possible:
1. Flexibility and customization
The first benefit of ad hoc analysis is flexibility and customization. On the one hand, ad hoc frameworks are extremely flexible. In what ways? They’re typically user-friendly and, more importantly, ease the analysis of various topics. On the other hand, it’s possible to configure ad hoc tools for every type of analysis. They’re extremely customizable.
Consequently, it makes sense to try ad hoc analysis because it can account for many black swan events. Traditional business tools may have no high-quality instruments for quantifying the effects of AI or RPA. Ad hoc analysis can give you several ideas for this quantification. As a result, ad hoc models are the most flexible tool on the market.
2. Speed and efficiency
What’s the key issue of large-scale models? They require a lot of time for configuring. Creating a dashboard in Google Analytics is a complex task. Various users of the platform complain about its complexity. When you’re configuring your Google dashboard for analysis, certain trends may become outdated in the meanwhile.
Consequently, it’s vital to have a tool that provides fast analysis. What is this tool? In our opinion, this tool is ad hoc analysis. It’s simpler than a full-scale data review. As a result, this instrument allows you to make fast decisions on new trends.
Some critics may argue that ad hoc analysis will never be complete. We agree. Many of its conclusions can be incomplete. However, there’s a major factor we need to consider: we don’t always need accuracy to make valuable predictions. Occasionally, what matters are broad trends. If a giant wave manifests at sea, it won’t cease to be giant despite being 15 meters instead of 20.
Similarly, major trends like AI may seem bigger than they’re in reality. Still, ad hoc analysis can correctly identify them as a strong field for investment. Even if the investments bring 20 billion dollars instead of 25, profits are still tremendous. Since innovations are increasingly complex, we have no time for months-long planning. You need to act as soon as possible to capture interesting niches. Ad hoc analysis is the fastest data-driven framework for decision-making.
3. Empowerment of business users
Lastly, every proper ad hoc framework empowers business users. It allows everyone to create high-quality analyses for certain topics quickly. Ad hoc analysis tools are typically easy to use. Consequently, you don’t need to be a statistician to use them well. Why is this so important for modern business? In our opinion, the answer is simple: more people can perform analytics. This, in turn, leads to better analysis. Different stakeholders have valuable views on business systems. For example, rank-and-file workers can report many problems with some practices that seem efficient. Ad hoc analysis lets them access the decision-making process. This approach, in our opinion, enables democracy in the workplace.
III. Types of Ad Hoc Analysis

Multiple types of ad hoc analysis exist. Let’s explore the key ways to perform it,
A. Ad hoc querying
The first type of ad hoc analysis and reporting is querying. In this regard, the key idea is to use modern databases. They enable two important things, easing ad hoc analysis:
1. SQL and NoSQL queries
SQL and NoSQL frameworks undoubtedly represent the key technology in ad hoc querying. The first databases for computers were linear. One had to go through all their elements to access data. For instance, a common method was to print large blocks of information. Contrary to past database frameworks, SQL and NoSQL methods allow an analysis of single data artifacts. It’s possible to do a query for user click rates for a particular element. Ultimately, this information means it’s easy to analyze small theories fast. How is this possible? Modern SQL and NoSQL frameworks store information in honeycomb-like structures. Every data element has its separate location. As a result, separate data elements aren’t connected into one block. This approach enables the users to print out information from small elements rather than whole files on a certain topic.
2. Data filtering and extraction
The honeycomb-like model would have been useless without proper search tools. Strong organization also requires potent instruments for searching data. In this regard, SQL and NoSQL both offer a solution through data filtering and extraction. Users can filter information based on certain criteria and get it from the relevant systems. For example, imagine you want to find out how many users from the 25 to 35 age range pay for a premium version of your product. In this respect, you can set search criteria to target a particular age and a premium app version. A NoSQL or SQL framework will immediately offer you some reports on this topic. For instance, they can be in the form of a chart. With the rise of AI, this tool will become especially strong. It may even be possible to generate a full-scale written analysis in particular cases.
B. Ad hoc reporting
Another set of tools that help with ad hoc analysis includes ad hoc reporting frameworks. They have two main features that the users should consider, in our opinion:
1. Customized reporting templates
Above all, a key tool for ad hoc reporting is a customized template. A customized template is precisely what it says on the tin. It combines data presentation formats and data generation tools that enable one to report information. For example, you can use this tool to quickly create charts for your colleagues. A reporting template can download information from some SQL database and then format it for analysis. This approach will be especially potent with the rise of AI. In this respect, we believe AI will soon be able to create high-quality templates. Telemus AI, an AI development business, openly proclaims that this is one of the strongest uses for this technology. The company expects ad hoc AI reporting tools to become popular. We agree with this analysis. Customized templates aren’t only the present but also the future of the ad hoc approach.
2. Dynamic data visualization
A major element of ad hoc reporting tools also includes advanced visualization. The key to efficient learning is multimodality. A person who wants to show they’ve learned something should be able to express their knowledge through text, audio, and visuals. For instance, top learners often express their knowledge through mind maps. Linear (text-based) note-taking and presentation are typically the worst ways to structure knowledge.
In many ways, ad hoc analysis considers this aspect. It promotes visualization for all data. For example, ad hoc tools advance visual explanations through embedded charts. Why is it so important? Many analytical concepts are difficult to explain. They involve complex subjects that require multiple years of education to understand. Proper visualization can make them more accessible to non-expert stakeholders. In this light, dynamic data visualization based on SQL and NoSQL queries is the key tool. With the help of AI and various algorithms, it’s possible to quickly generate advanced presentations for all stakeholders. Ad hoc analysis is notable not only for speed but also for simplicity.
C. Ad hoc data exploration
Apart from presentations, ad hoc tools must also have strong exploration tools. Making decisions on presentations is impossible without understanding what data you need first. For this reason, let’s look at the key data exploration tools you require here.
1. Data discovery and pattern recognition
The key tool in proper data exploration is data discovery and pattern recognition. Above all, every strong tool for ad hoc analysis must be able to quickly find data. How can it do this? The best way is to connect those frameworks to the SQL and NoSQL databases. Connection to the Internet and other data sources, such as Google Analytics, is also essential. Using it, the relevant tool can quickly get key data and present it to you.
More importantly, modern ad hoc tools promote more and more pattern recognition frameworks. We’re especially optimistic about the rise of AI frameworks. What can they do in this respect? In our opinion, these tools automate many data analysis elements. Pedro J. Navarro from the University of Cartagena and his colleagues have presented a strong ad hoc AI-based analysis tool. It’s called 3DeepM. This tool analyzes images to then produce interesting insights on them. For instance, it’s usable for the analysis of various physical products. You can use it to find defects in the tools your company manufactures.
Another efficient approach is to scan various dialogues with customers on social media. 3DeepM and similar AI tools find many interesting trends and assist you with capitalizing on them. Why is this tool so important? It showcases how comfortable ad hoc analysis will be in the future. We believe decision-makers will be able to skip many steps in their analysis due to this advantage.
2. Interactive data visualization
We’ve already mentioned that a strong ad hoc solution involves data visualization. This isn’t sufficient, however. Another vital element of an efficient ad hoc framework is interactivity. The users should also be able to configure data according to their needs. In this regard, ad hoc interactive data tools are becoming increasingly popular. What’s the best way to display this information properly? In our opinion, you should look toward dashboards. A strong dashboard possesses all the key information about a certain data set. In this respect, IBM, for example, reports that ad hoc tools are essential for its internal dashboard solutions. More importantly, it’s possible to put in queries for different types of data. You can ask for a breakdown of click-through rates according to date or user type. In other cases, one can review how people listen to a particular musical style. In short, you have a vast number of options here. A well-prepared ad hoc interactive data set will likely provide data for many users over the years.
IV. Ad Hoc Analysis Tools and Techniques

Ad hoc analysis tools and techniques are numerous. In this part of the article, we want to review the most important ones:
A. Spreadsheets and data manipulation tools
Let’s first review the key frameworks for working with data analysis. In this respect, some of the most well-received tools include spreadsheet tools. Why are they so great for ad hoc analysis? In our opinion, two reasons for this exist. Firstly, these tools are all-pervasive. Most business customers actively use Excel or Google Sheets in sales. Consequently, Google Sheets or Microsoft Excel are the most common tools for storing data. Secondly, they’re also convenient. Both frameworks have advanced visualization tools.
1. Microsoft Excel
Microsoft Excel is a brand name synonymous with spreadsheets. When people talk about them, the majority means Excel. Let’s review the key advantages and problems of this platform.
Advantages
On the one hand, Excel undoubtedly offers the most advanced spreadsheet tools on the market. No other instruments have the macros tools and formula capabilities of Excel. Excel is among the top choices if you want to create a complex outline of some data. It supports gigantic spreadsheets. More importantly, it analyzes them extremely fast. Professional comparisons clearly show that Excel is superior to Google Spreadsheets for complex tasks. Our experience also shows it’s more efficient than open-source and proprietary alternatives. LibreOffice and WPS Office are incapable of approaching Excel in terms of speed.
Disadvantages
On the other hand, Microsoft Excel has major issues, too. Firstly, its data visualization tools are poor. It has typical office visualization instruments such as charts. Any other approaches require outside software. Many of them are inconvenient due to being, for example, community-made.
Secondly, a major problem with Excel is that it’s primarily desktop-oriented. Even in the 365 cloud form that Microsoft presents today, its desktop-like paradigm remains. Integration of different Excel files is often difficult, even if they’re present on one platform. Besides, one should note that Office 365 isn’t cheap. Businesses have to spend sizeable amounts of funds to buy Microsoft subscriptions. Old one-time purchases were expensive, too.
Consequently, the benefits of this platform for various non-technical frameworks can be low. In numerous instances, its spreadsheet capabilities are too complex. At the same time, the visualization capacity of those tools isn’t as advanced.
2. Google Sheets
Google Sheets will likely become a de facto standard for most spreadsheets this decade. The tool gained popularity over the 2010s and is ready to take the spreadsheet throne. Hjalmar Gislason reports that young businesses (startups) overwhelmingly use Google Sheets. Yes, Excel is more popular for now. It had 800 million users in 2018, as opposed to approximately 200 million for Google Sheets. This trend is valid today, too. Still, the user base of Excel isn’t growing. Once older organizations facing vendor lock-in close down, we expect a massive popularity boost for Google Sheets. Why does this happen? In our opinion, ad hoc analysis capabilities are among the key explanations.
Reasons why Google Sheets is superior to Excel
Firstly, Google Sheets has better visualization capabilities. It’s a part of a massive ecosystem of analytical tools. For instance, one can connect their spreadsheet to Google Analytics. In this way, they’ll access one of the most advanced analytical platforms on the web. Secondly, Google Sheets is much more interactive. The tool promotes online collaboration for the users. As a result, it stimulates a positive data management culture. Stakeholders may combine analysis of data in Google Analytics and then analyze the spreadsheets behind them. Sharing and checking all the information is much easier than in other cases. Why is this important? This approach will make ad hoc in finance much easier. Analysts from different firms will be able to review data from their colleagues and check it for validity. With Microsoft Excel, such collaboration is much more difficult to imagine.
Future prospects
Consequently, we expect Google Sheets to continue gaining popularity. Yes, it’s simpler than Excel. However, most companies don’t need all those features. Excel will likely become an incredibly niche tool reserved for expert tasks.
B. Business intelligence (BI) and analytics platforms
Some tools are more tailored towards data analysis. Let’s look at modern business intelligence and analytics platforms in this regard. As you can see, many of them offer interesting options for a high-quality ad hoc analysis.
Tableau
Tableau has the following features that can assist you in making decisions:
- Drag-and-Drop Interface. Tableau provides a user-friendly drag-and-drop interface. It lets users quickly create visualizations by dragging and dropping fields onto a canvas.
- Instant Data Exploration: Users are able to easily explore data by interacting with visualizations. They can click on data points to learn more details and filter information. As a result, different stakeholders get an opportunity to review information from their standpoint.
- Live Connection to Data: Tableau supports live connections to various data sources. It enables users to work with real-time data. More importantly, it guarantees that the analysis reflects the most up-to-date information.
Dashboard Interactivity: Dashboards in Tableau are interactive. They allow users to change parameters and apply various filters. In this way, any person can find information that is vital to them.
Power BI
Power BI is another vital tool for users who want to do ad hoc analysis. Here are some of the key elements you need to review:
- Power Query: Power BI’s Power Query Editor allows users to shape data before it’s visualized. This flexibility is crucial for ad hoc analysis, enabling users to prepare data on the fly.
- DAX (Data Analysis Expressions): Power BI uses DAX for creating calculated columns and measures. This powerful formula language allows users to perform complex calculations. What’s the problem here? Integration with Microsoft tools isn’t as potent as it could have been in this case.
- Quick Insights: Power BI has a feature called Quick Insights that automatically generates insights and visualizations based on given data. Using it, you can provide the clients with starting points for further exploration.
- Natural Language Query: Power BI supports natural language queries. It allows users to ask questions about their data using plain language. Why is this feature so vital? It enables users without technical expertise to make their findings. Analysis isn’t limited to people with technical expertise, in this case. Ultimately, this approach allows many companies to promote a data-oriented culture.
Qlik
Lastly, let’s review the tools that can help organize knowledge in Qilk. In our opinion, this platform also has great tools for organizing information.
- Associative Data Model: Qlik’s associative model allows users to explore data without predefined paths. Users can make dynamic associations between different data points, facilitating ad hoc exploration.
- Drag-and-Drop Interface: Similar to Tableau, Qlik uses a drag-and-drop interface for creating visualizations. This ease of use helps users quickly build and modify charts and dashboards.
- On-the-Fly Data Transformation: Qlik allows users to transform and manipulate data on the fly. How does it do this? It uses a special in-memory engine, enabling quick iterations in ad hoc analysis.
- User Collaboration: Qlik’s associative sharing and collaboration features allow multiple users to explore and analyze data together. As a result, the platform fosters a collaborative ad hoc analysis environment.
C. Ad hoc analysis techniques
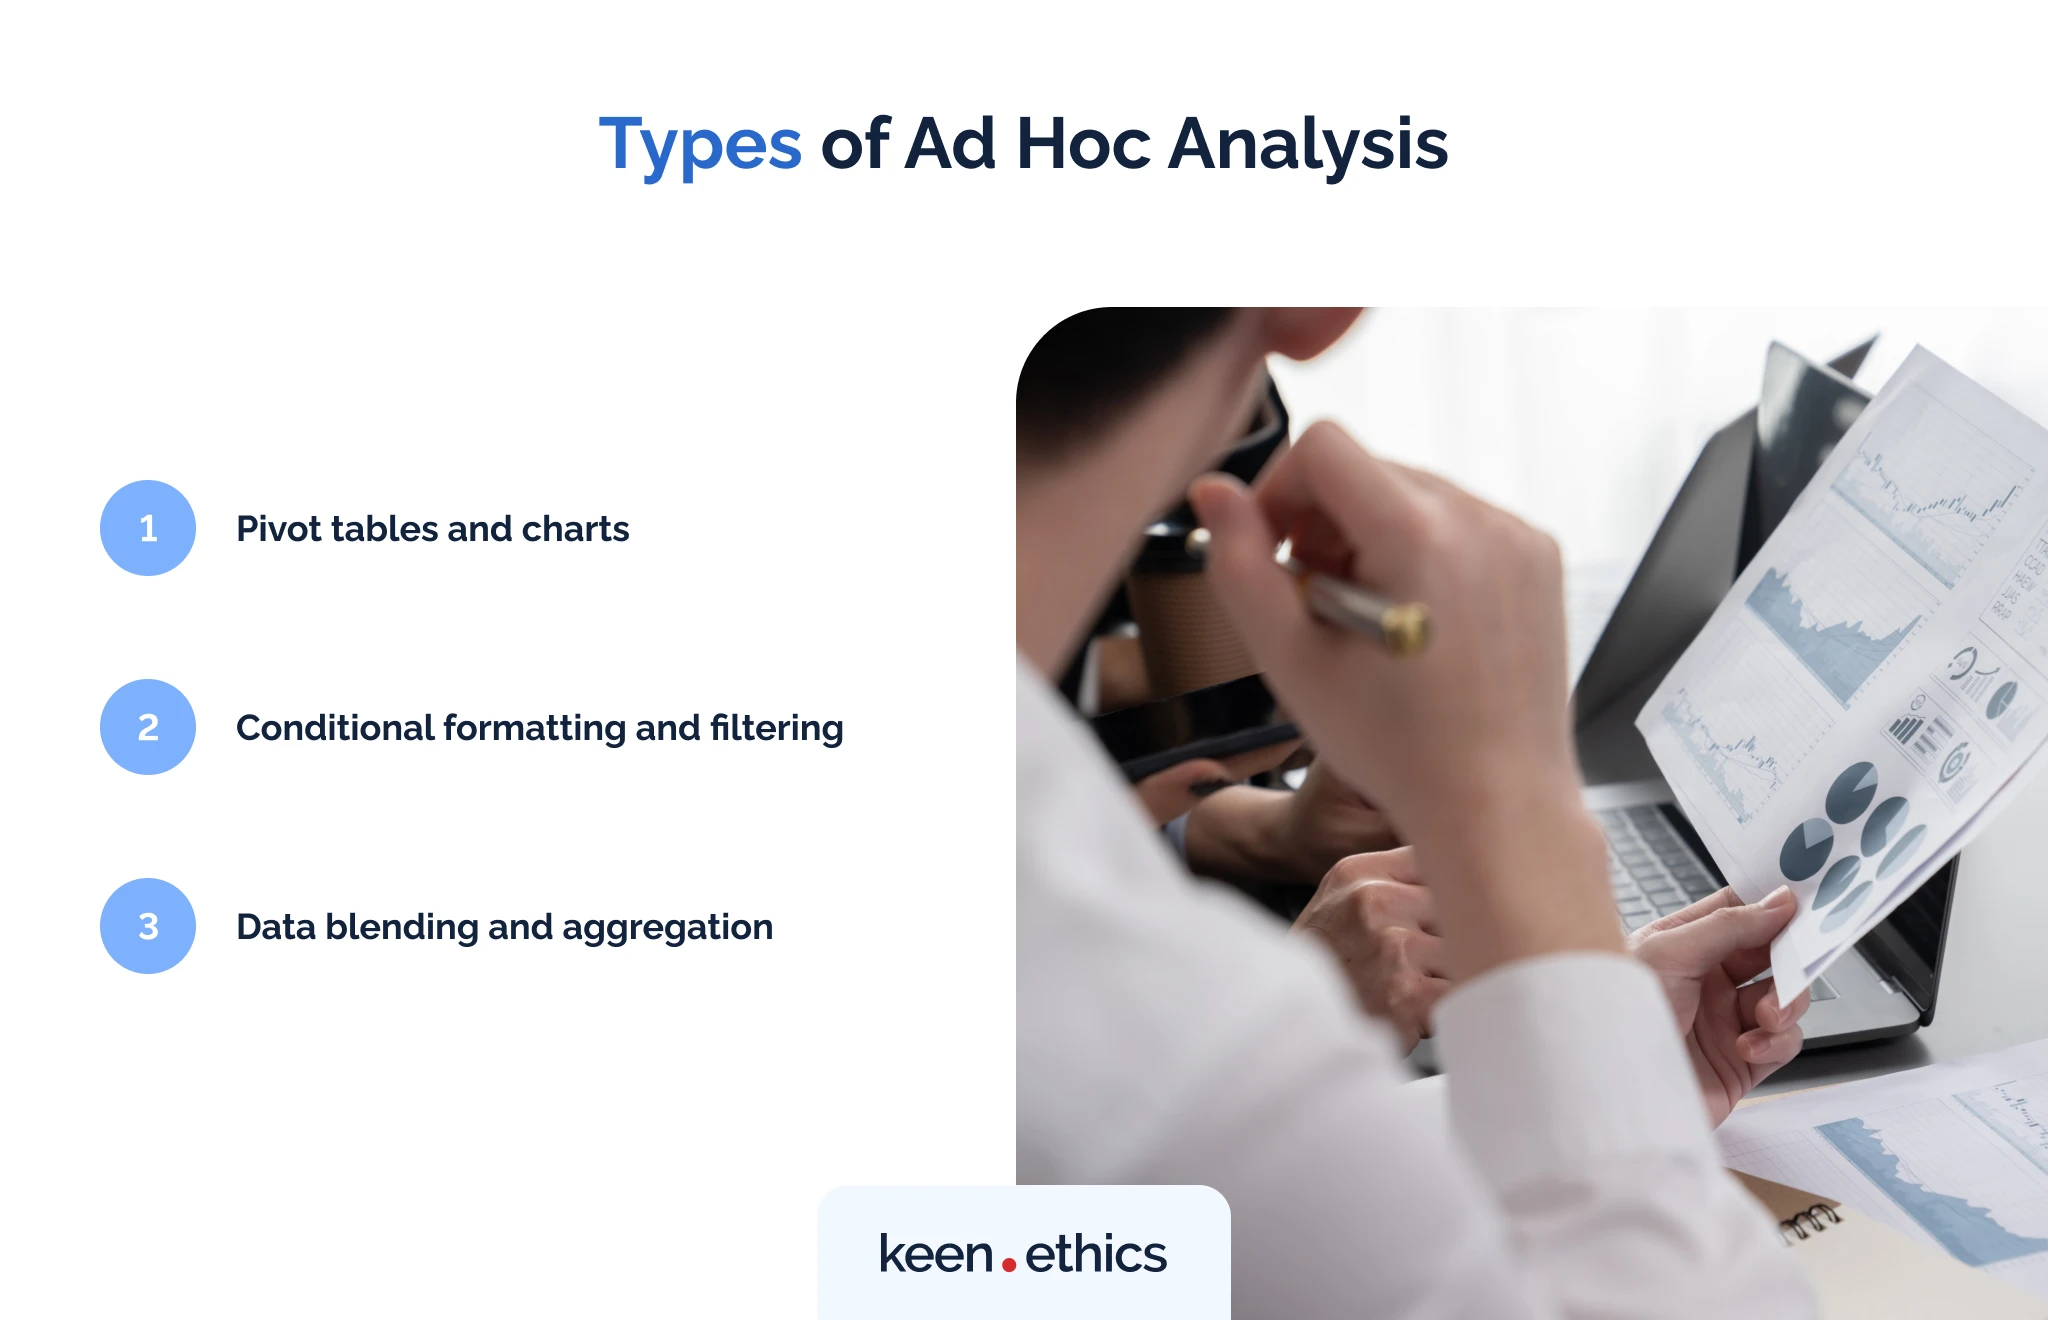
Now that we understand the tools for ad hoc analysis, it’s time to understand how to improve their utility. The best way to do this is to use specific data analysis methods. Here are some of the best options for this goal:
1. Pivot tables and charts
Let’s first analyze the things you can create in Excel and Google Sheets. In this respect, the key instruments available to the users are pivot tables and charts. What do they do? A pivot table is a summary table with all key data from certain documents. For instance, you can collect all financial data in one massive pivot table. Why is it so important? This approach allows integrating all data sources into one format. Consequently, analyzing them together and finding interesting connections between data sets becomes easier.
And what about charts? They can help visualize the knowledge you have. Ultimately, it becomes easier to see data in movement. You can understand growth in your daily stats or problems with them. All that is necessary to create such data sets is to use spreadsheets. Modern tools in Excel and Google Sheets automate the majority of other processes.
2. Conditional formatting and filtering
Conditional formatting and filtering are another vital step in analyzing static data. The first option allows highlighting the data that fits your needs. For example, you can ask a BI platform or a spreadsheet manager to showcase financial information. In this way, one can separate important information from non-important. As for the second option, we have filtering. Filtering allows one to exclude elements they would rather not see. Ad hoc reporting tools have many configurations that enable this function. Ultimately, basic filtering is possible even with search tools. One can look only for the keywords they want to review. Why is all this essential? In our opinion, such frameworks help remove noise in information and concentrate on vital aspects.
3. Data blending and aggregation
Data blending and aggregation are significant techniques for getting insights from different datasets. In tools like Tableau, data blending integrates information from multiple sources. This approach allows users to correlate and analyze disparate data sets. This capability is vital for holistic analysis. After all, it helps uncover connections between different data elements. Aggregation, meanwhile, involves summarizing data to reveal trends and patterns. Functions like sum, average, and count provide an advanced view of the data, simplifying complex datasets. These techniques empower users to perform in-depth ad hoc analysis. Ultimately, we get an opportunity to combine and analyze data flexibly for more informed decision-making.
V. Best Practices for Effective Ad Hoc Analysis
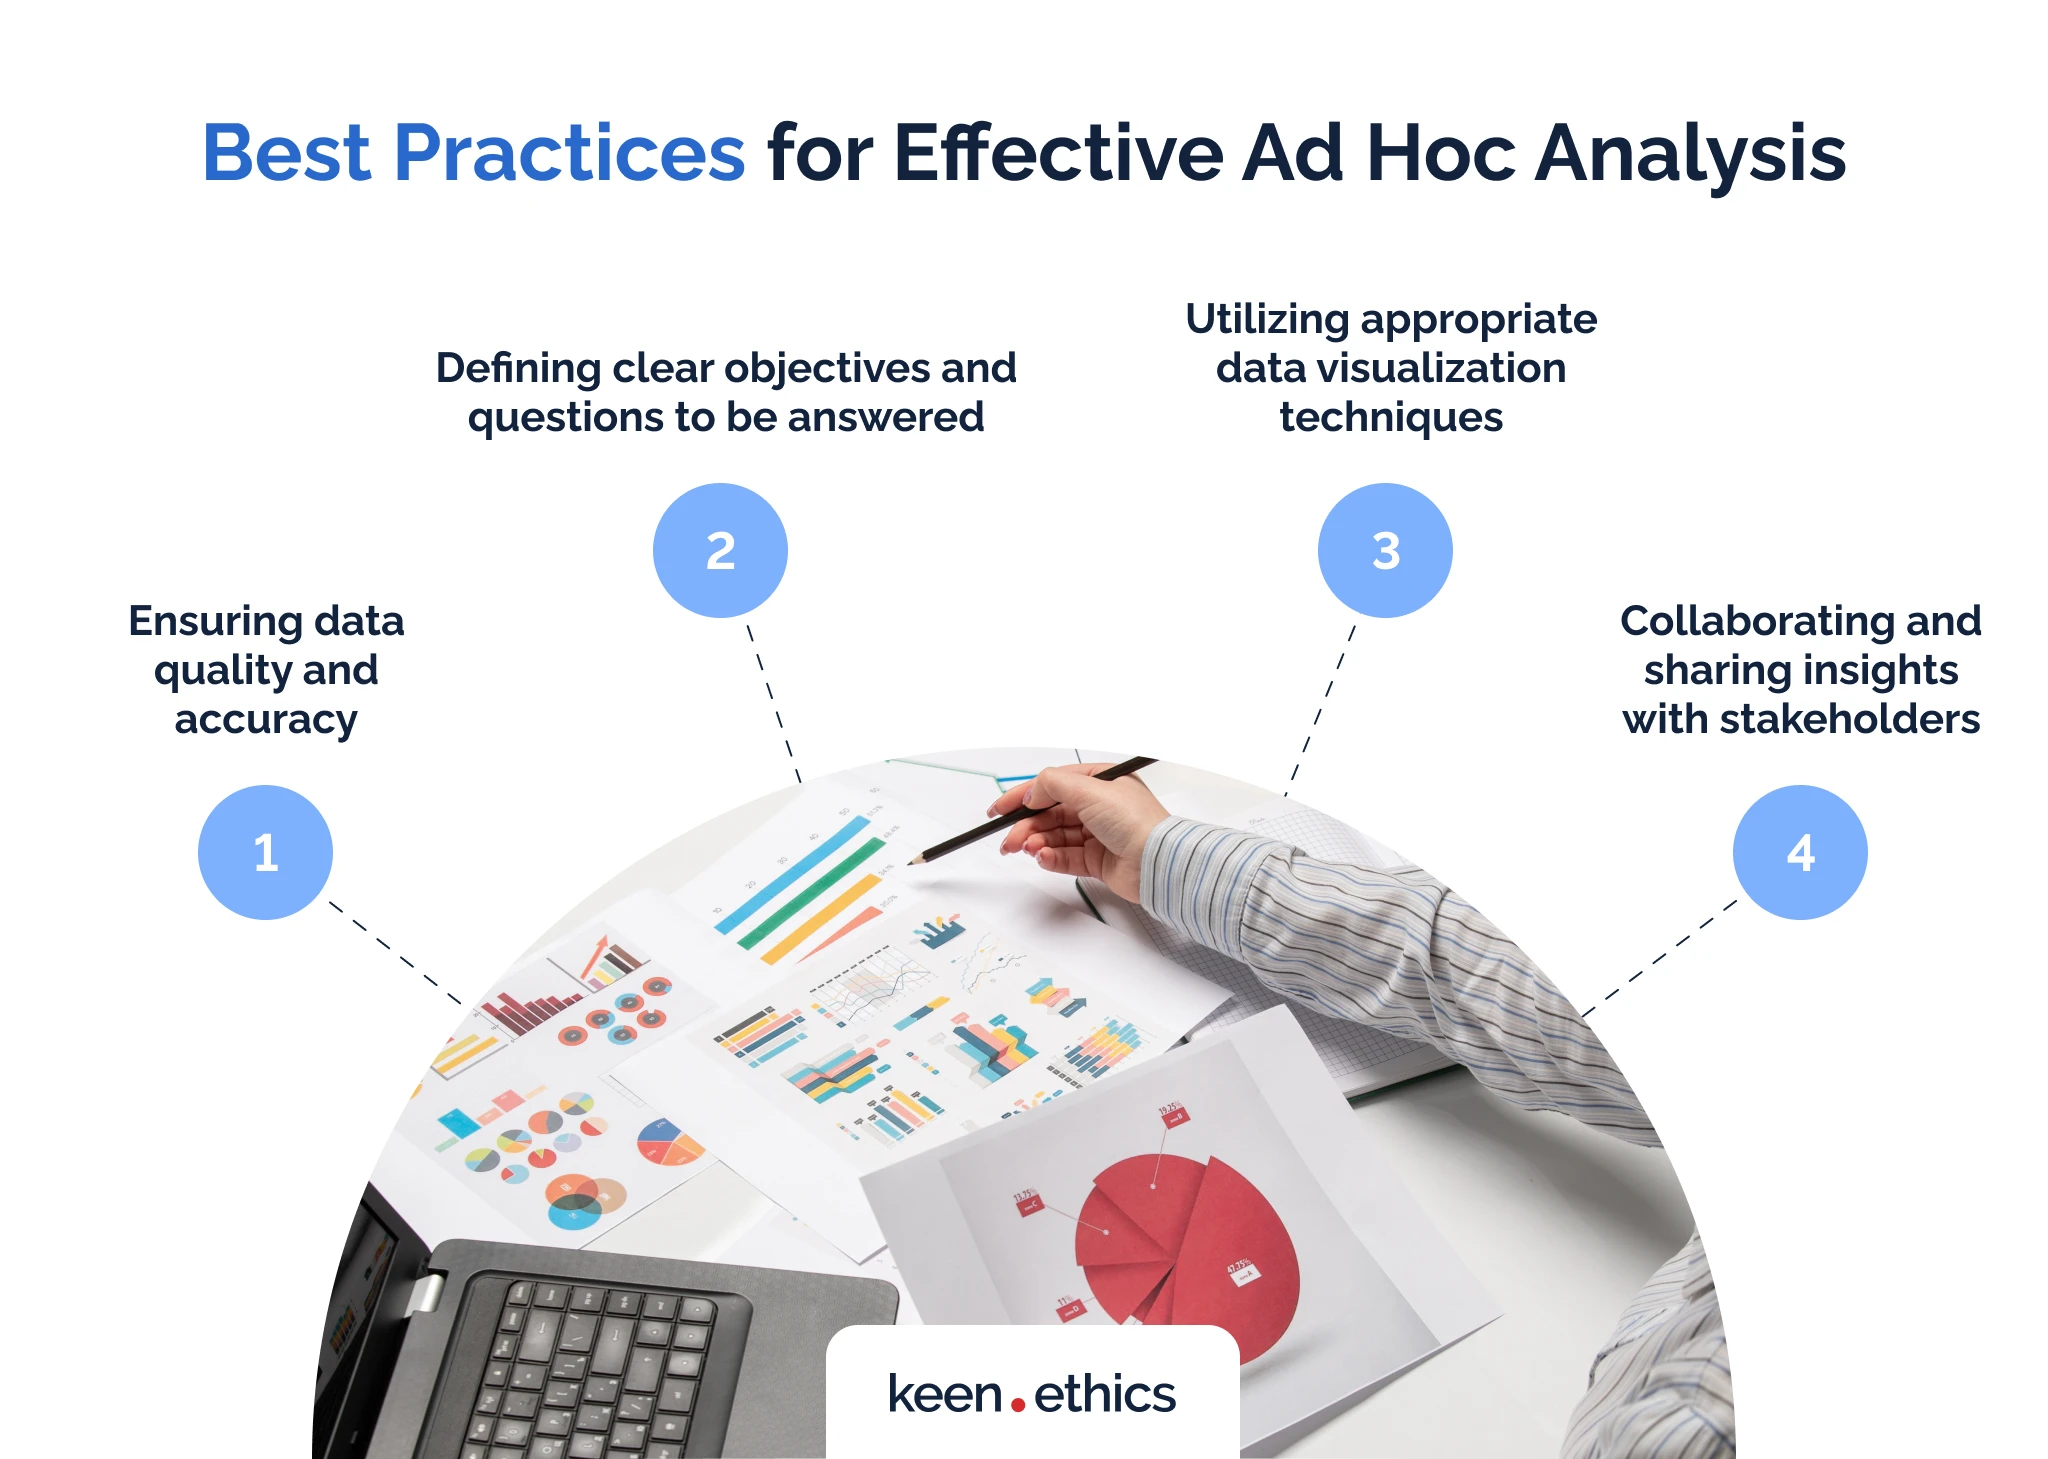
We believe that several best practices for effective ad hoc analysis exist. Here are the key things you need to consider:
A. Ensuring data quality and accuracy
No ad hoc financial reporting would be accurate if data is forged. This factor reveals the key challenge for all types of analysis. It relies on the quality and accuracy of the available data. Many companies have tremendous amounts of data, but it’s inaccurate. For example, it may easily reflect the biases of certain influence groups. A widespread situation is for the leaders of certain departments to hide the real state of affairs. In fact, the 2008 financial crisis became an outcome of such a problem. Lehman Brothers management deliberately hid vital transaction data from the government. When the lies of the management became obvious, it was already too late.
Ultimately, we see two ways to improve the existing issues with data analysis.
Solution 1. Hiring more managers
On the one hand, you can try to hire more managers and have greater control over the workers. What’s the concern here? Your firm may eventually become overmanaged. Even today, we have one manager per 11 people. If this number goes down, up to a fifth of our workforce can be made of managers. Why is this so bad? A tremendous number of non-productive workers will appear in the economy.
Solution 2. Using automation
On the other hand, you can start using more and more automatic tools for analysis. Modern AI can find various trends in user behavior without human input. More importantly, its complexity makes the majority of its choices independent. What’s the problem with this approach? It’ll likely be costly in the short run, requiring major investments into training and development. More importantly, you’ll have to find people with unique skills for your workforce. What are some control-oriented competencies for getting high-quality data through AI? In our opinion, the relevant workers must be able to process data fast and have a good eye for spotting irregularities. Otherwise, you risk distorting the data through hallucinations common for modern AI.
B. Defining clear objectives and questions to be answered
A key goal for advanced ad hoc analysis is asking a specific question. This approach allows you to test one hypothesis instead of several issues. In this respect, you should learn to define clear objectives and present proper questions. How to do this? In our opinion, you should learn the following skills:
Prioritizing information
You should understand how to prioritize information. We recommend training your deep processing skills to achieve this. Deep processing involves the ability to find key trends in the information you’re reading. According to Bloom’s Taxonomy of Learning, you must have skills in knowledge analysis, evaluation, and creation to perform deep processing. How to train those skills? We have an interesting exercise for doing this: try to present all your learning and analysis in a minimal format. Your goal is to have a minimal word count for all those tasks. Why is this important? The fewer words you use, the more likely you’ll see vital information. Feynman’s technique is great, too: try to explain your analysis to a five-year-old or a non-expert. If you can do this, then your explanation is clear enough.
Being mindful and present
You must be constantly present in your work. Various Nobel-worthy inventions stem from chance discoveries. For instance, penicillin was discovered by chance, according to the National Library of Medicine (U.S.). Some readers may claim that people like Alexander Fleming were lucky. We disagree. They had one major virtue many people don’t have. This virtue is attention. They were present in their work and managed to see trends others couldn’t discover. You should learn to do the same thing if you want to succeed. In this respect, the best practice is to try mindfulness meditation. You should learn to concentrate for periods that are as long as possible.
C. Utilizing appropriate data visualization techniques
We’ve already mentioned that visualization is the basis of high-quality ad hoc analysis. Let’s review the best practices for data visualization. Firstly, you should learn to minimize information in your visuals. It’s fine to have detailed breakdowns, but they shouldn’t be the highlight of your presentation. Put them at the end of the visualization. The “face” of your presentation should be simple. In this regard, the key goal is to choose and showcase the key metric.
Secondly, we recommend learning several data presentation formats. In this light, you should understand how line graphs and pie charts work. Moreover, it’s important to test all data points with multiple elements. Certain information is much easier to see in pie charts than in area charts.
Lastly, we recommend paying attention to high-quality visuals. Modern charting tools in Microsoft Excel and Google Sheets are so potent that you rarely need changes. Simultaneously, if you use BI frameworks, it may be beneficial to use outside tools. If your company has site designers, you can also ask them to present findings for you in a proper format. Ad hoc analysis should look as clean as possible. Only this approach will help attract enough attention to it.
D. Collaborating and sharing insights with stakeholders
The final element of all ad hoc analysis is proper collaboration. Your goal is to prepare data for a specific set of stakeholders. This factor allows us to raise several additional points. The primary one is that all your ad hoc analysis presentations should be interactive. Your audience must be able to access a presentation and then search for insights it wants to find. The preceding steps are essential to make this process possible.
Why is collaboration and insight sharing with stakeholders so important? Ad hoc analysis is extremely fast and often involves new trends. This information means missing vital elements in the key data is easy. When you share data with stakeholders, you decrease the risks of missing significant insights. For example, marketing and development departments can uniquely contribute to AI analysis. In this way, sharing enables a truly multifaceted analysis. When multiple people from your organization provide their opinions, maximizing the benefits of insights is easier.
VI. Challenges and Limitations of Ad Hoc Analysis
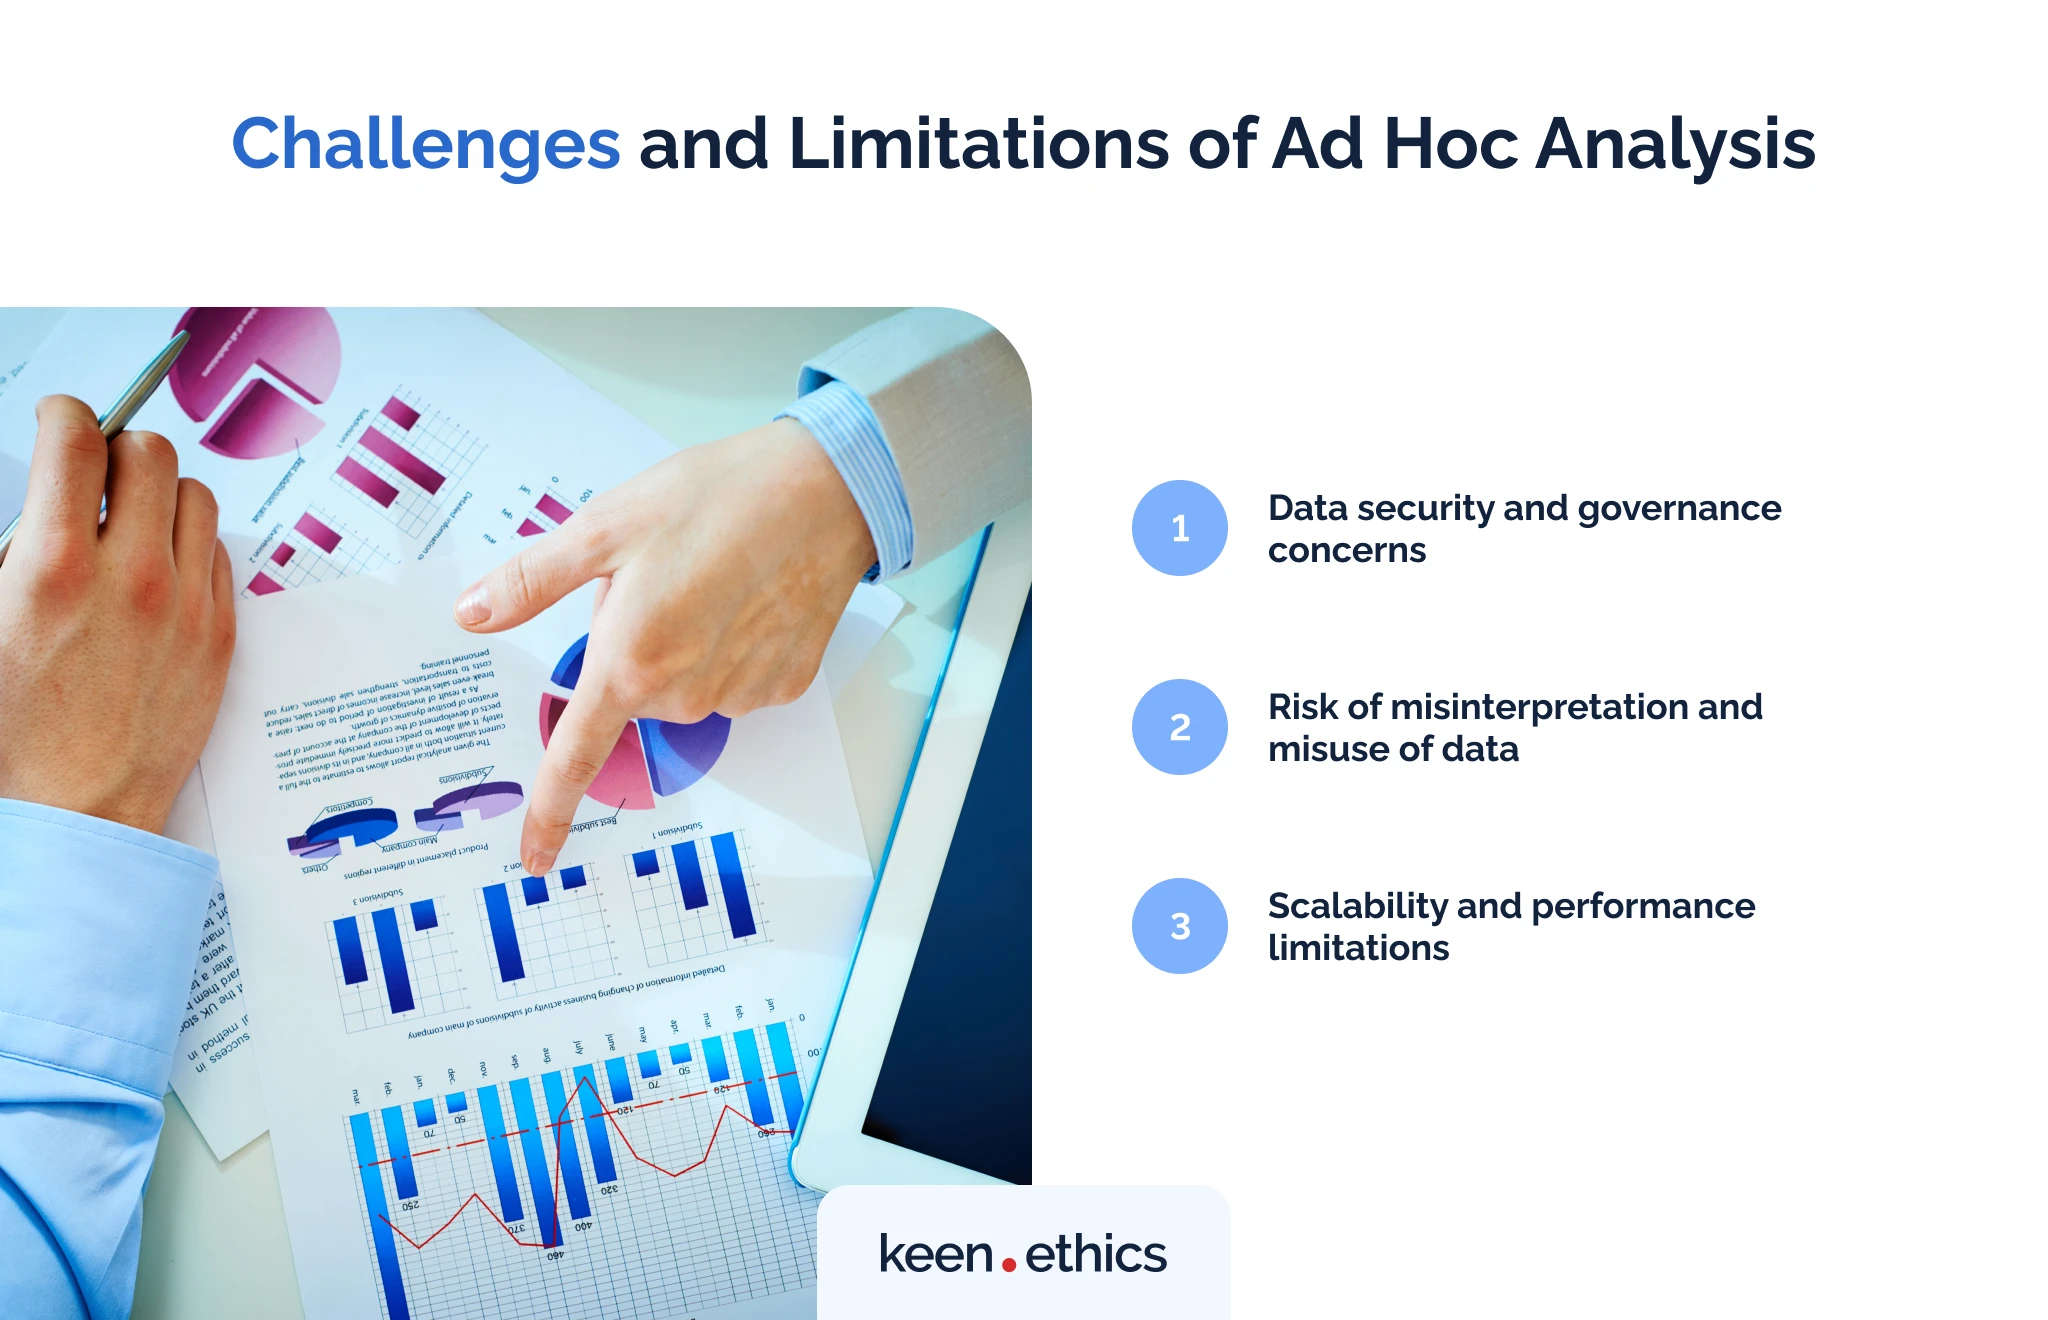
Nonetheless, ad hoc analysis also offers some significant challenges and limitations. We believe it’s essential to understand the problems of the methods you use to avoid major issues. So, what are the key challenges? Here they’re:
A. Data security and governance concerns
Data security is the first concern of all analyses, including ad hoc ones. Most types of ad hoc reports are available only via Internet tools. In this light, situations when a breach in some service can leak vital insights are common. Data leaks happen every year. They affect both large and small firms. More importantly, they impact both “serious” and “relaxed” companies. For instance, there was a major information leak from Equifax in 2017. Equifax is one of the best credit reporting businesses in the American market. Engadget reports that Signal, a messenger proclaiming itself to be among the safest, also had data breaches due to third-party troubles. Consequently, you should consider maximal security for your ad hoc data.
B. Risk of misinterpretation and misuse of data
Another major problem of ad hoc analysis is misinterpretation. Misinterpretation can happen in “bigger” analysis, too. However, ad hoc analysis is especially prone to it due to being speed-oriented.
Still, there’s an additional issue. Ad hoc analysis is also limited to particular challenges. As a result, it rarely gives enough insights into the bigger picture. For instance, various businesses misinterpreted AI based on its presentations. A common reaction was to downsize content teams. In reality, LLM AI models often hallucinate.
Consequently, companies like CNET faced massive reputation concerns due to rash decisions. In this case, AI texts produced for CNET proved to be low-quality and full of falsehoods. Ad hoc analysis performed when this technology arose was incorrect. It was too fast and too limited when it came to data.
C. Scalability and performance limitations
Lastly, many types of ad hoc analysis aren’t scalable. This issue manifests in two ways. On the one hand, the results of this analysis tend to be isolated. Advancing it to bigger problems in your firm is difficult. On the other hand, various tools of this type are inadequate for expanding analysis. Their goal is to be user-friendly and visually appealing. This means many visualization tools for ad hoc analysis don’t work well with large amounts of data. In many situations, ad hoc analysis will be limited to some particular challenges.
VII. Integrating Ad Hoc Analysis with Traditional Analytics Approaches

Ad hoc analysis primarily helps with transforming old theories. At the same time, it has difficulties with scalability. In this light, you should learn to integrate ad hoc analysis with traditional approaches.
A. Balancing ad hoc analysis with predefined reports and dashboards
You should first learn to balance ad hoc analysis with predefined reports and dashboards. In this regard, we believe the best choice is to look at the philosophy of science. In general, two schools exist concerning the development of scientific knowledge. Some philosophers think science develops through evolution. Others proclaim that it goes through major revolutions. In our opinion, both approaches are correct. Past theories are the lower level of knowledge. They describe some particular cases in bigger theories. Revolutions are a part of a bigger evolution.
Consequently, ad hoc analysis is the mechanism for such transformation. It helps transform past business theories into parts of newer and bigger ones. Here are the key three steps we recommend:
- Never throw away past theories. Learn how to integrate them.
- Use ad hoc analysis to challenge old assumptions and create bigger theories.
- Understand that absolute truth doesn’t exist: our knowledge is constantly expanding.
B. Incorporating ad hoc insights into business processes and decision-making
Another important step we recommend is to make ad hoc analysis a part of your processes. It shouldn’t just be a random activity in your company. No, you must perform ad hoc analysis as a part of a bigger analysis. What approach do we recommend?
- Create large-scale theories based on well-verified data;
- Use ad hoc analysis to review new trends and challenge the existing strategies.
C. Establishing a data-driven culture within the organization
Lastly, establishing a data-driven culture in your organization is a major aspect of ad hoc analysis. Ad hoc tools are simple to use. In this light, you should promote them among as many people as possible. A positive data-driven culture involves two elements:
- Thorough approach to data collection;
- The ability of every employee to participate in the analysis.
How to promote it? The best option is to offer rewards for interesting insights. Workers who engage in the analysis should receive monetary bonuses. Another significant aspect is to advance worker democracy. A strong data-driven culture demands freedom of speech. Your workers should be able to present their vision of various challenges.
VIII. Future Outlook: The Role of Ad Hoc Analysis in the Age of Big Data and AI
No ad hoc report example is possible without mentioning innovations transforming ad hoc analysis.
A. The impact of Big Data on ad hoc analysis requirements
The first technology impacting ad hoc analysis is Big Data. In our opinion, it’s obvious why this innovation is so vital. Big Data greatly improves two aspects. Firstly, it raises the amount of available information. Secondly, it allows for reviewing more available data in general. As a result, it’s possible to analyze more and see greater trends. If you want to do a strong ad hoc analysis, learning Big Data is essential.
B. Leveraging AI and machine learning for advanced ad hoc analysis
Another important technology for ad hoc analysis is AI. Machine learning tools behind it are notable for their ability to review a lot of data. For example, ChatGPT 3.5 uses 45 terabytes of information as its basis. In this light, you can train machine learning models to analyze tremendous amounts of data. In this way, it’ll be possible to create Big Data that will highlight some genuinely in-depth issues.
C. The importance of ad hoc analysis in the era of data democratization
Lastly, ad hoc analysis is central because data is becoming increasingly open. Today, most people can access tremendous repositories of data. For instance, sites like Statista offer a lot of open information. If there’s an opportunity to analyze modern trends in the market, why not use it? After all, many types of information are free. Many governments and private organizations share a lot of insights.
IX. Conclusion
To summarize, ad hoc analysis is a strong tool for modern companies. It’s crucial for reviewing new trends in the market. In many ways, ad hoc assumptions can become a path to transforming your entire business model. For this reason, we recommend every firm on the market to try this practice. The market is changing all the time. Ad hoc analysis may help you avoid this problem. If you want assistance with this practice, don’t hesitate to contact professionals. In this respect, Keenethics has over eight years of experience developing software for various businesses.
Today, ad hoc analysis is an essential element in business theory creation. Develop your tool together with Keenethics.